Statistics Class 9 MCQ is one of the best strategies to prepare for the CBSE Class 9 Board exam. If you want to complete a grasp concept or work on one’s score, there is no method except constant practice. Students can improve their speed and accuracy by doing more Statistics class 9 MCQ which will help them all through their board test.
Statistics Class 9 MCQ Questions with Answer
Class 9 Math MCQ with answers are given here to Chapter 14 Statistics. These MCQs are based on the latest CBSE board syllabus and relate to the latest Class 9 Math syllabus. By Solving these Class 9 MCQs, you will be able to analyze all of the concepts quickly in the Chapter and get ready for the Class 9 Annual exam.
Learn Statistics Class 9 MCQ with answers pdf free download according to the latest CBSE and NCERT syllabus. Students should prepare for the examination by solving CBSE Class 9 Statistics MCQ with answers given below.
Question 1. In a frequency distribution, the mid value of a class is 10 and the width of the class is 6. The upper limit of the class is:
(a) 6
(b) 7
(c) 10
(d) 13
Answer
D
Question 2. The width of each of five continuous classes in a frequency distribution is 5 and the lower class-limit of the lowest class is 10. The lower class-limit of the highest class is:
(a) 15
(b) 30
(c) 35
(d) 40
Answer
B
Question 3. The class mark of the class 90-130 is:
(a) 90
(b) 105
(c) 115
(d) 110
Answer
D
Question 4. The range of the data:
25, 81, 20, 22, 16, 6, 17,15,12, 30, 32, 10, 91, 8, 11, 20 is
(a) 10
(b) 75
(c) 85
(d) 26
Answer
C
Question 5. In the class intervals 10-20, 20-30, the number 20 is included in:
(a) 10-20
(b) 20-30
(c) both the intervals
(d) none of these intervals
Answer
B
Question 6. A grouped frequency table with class intervals of equal sizes using 250-270 (270 not included in this interval) as one of the class interval is constructed for the following data:
268, 220, 368, 258, 242, 310, 272, 342, 310, 290, 300, 320, 319, 304,402, 318, 406, 292, 354, 278, 210, 240, 330, 316, 406, 215, 258, 236.
The frequency of the class 370-390 is:
(a) 0
(b) 1
(c) 3
(d) 5
Answer
A
Question 7. Let m be the mid-point and 1 be the lower class limit of a class in a continuous frequency distribution. The upper class limit of the class is:
(a) 2m + l
(b) 2m – l
(c) m – l
(d) m – 2l
Answer
B
Question 8. The class marks of a frequency distribution are given as follows:
15, 20, 25, …
The class corresponding to the class mark 15 is:
(a) 12.5 – 17.5
(b) 17.5 – 22.5
(c) 18.5 – 21.5
(d) 19.5 – 20.5
Answer
A
Question 9. The mean of five numbers is 30. If one number is excluded, their mean becomes 28. the excluded number is:
(a) 28
(b) 30
(c) 35
(d) 38
Answer
D
Question 10. If x¯ represents the mean of n observations x1, x2, …, xn, then value of ∑ni=1(xi−x¯) is:
(a) -1
(b) 0
(c) 1
(d) n – 1
Answer
B
Whoever needs to take the CBSE Class 9 Board Exam should look at this MCQ. To the Students who will show up in CBSE Class 9 Math Board Exams, It is suggested to practice more and more questions. Aside from the sample paper you more likely had solved. These Statistics Class 9 MCQ are ready by the subject specialists themselves.
Question 11. A grouped frequency distribution table with classes of equal sizes using 63-72 (72 included) as one of the class is constructed for the following data:
30, 32, 45, 54, 74, 78, 108, 112, 66, 76, 88, 40, 14, 20, 15, 35, 44, 66, 75, 84, 95, 96, 102, 110, 88, 74, 112, 14, 34, 44.
The number of classes in the distribution will be:
(a) 9
(b) 10
(c) 11
(d) 12
Answer
B
Question 12. To draw a histogram to represent the following frequency distribution:
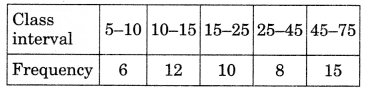
the adjusted frequency for the class 25-45 is:
(a) 6
(b) 5
(c) 3
(d) 2
Answer
D
Question 13. If x¯ is the mean of x1, x2, …, xn, then for a ≠ 0, the mean of ax1, ax2, …, axn, x1a, x2a, …….., xna is
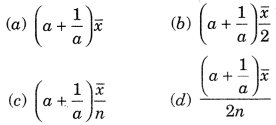
Answer
B
Question 14. If x1¯, x2¯, x3¯, …….., xn¯ are the means of n groups with n1, n2, ……. nn number of observations respectively, then the mean x of all the groups taken together is given by:
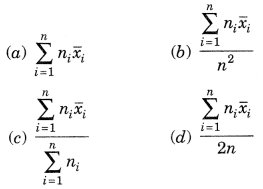
Answer
C
Question 15. If each observation of the data is increased by 5, then their mean
(a) remains the same
(b) becomes 5 times the original mean
(c) is decreased by 5
(d) is increased by 5
Answer
D
Question 16. Let x¯ be the mean of x1, x2, …, xn and y the mean of y1, y2, …, yn. If z is the mean of x1, x2, …. xn, y1, y2, …, yn, then z is equal to
(a) x¯+y¯
(b) x¯+y¯2
(c) x¯+y¯n
(d) x¯+y¯2n
Answer
B
Question 17. Mode of the data
15, 14, 19, 20, 16, 15, 16, 14, 15, 18, 14, 19, 16, 17, 16 is
(a) 14
(b) 15
(c) 16
(d) 17
Answer
C
Question 18. The mean of 25 observations is 26. Out of these observations if the mean of first 13 observations is 22 and that of the last 13 observations is 30, the 13th observation is:
(a) 23
(b) 26
(c) 28
(d) 30
Answer
B
Question 19. The median of the data
78, 56, 22, 34, 45, 54, 39, 68, 54, 84 is
(a) 45
(b) 49.5
(c) 54
(d) 56
Answer
C
Question 20. For drawing a frequency polygon of a continous frequency distribution, we plot the points whose ordinates are the frequencies of the respective classes and abcissae are respectively:
(a) upper limits of the classes
(b) lower limits of the classes
(c) class marks of the classes
(d) upper limits of preceding classes
Answer
C
You can easily get good marks If you study with the help of Class 9 Statistics MCQ. We trust that information provided is useful for you. NCERT MCQ Questions for Class 9 Statistics PDF Free Download would without a doubt create positive results.
We hope the information shared above in regards to MCQ on Statistics Class 9 with Answers has been helpful to you. If you have any questions regarding CBSE Class 9 Math Solutions MCQs Pdf, write a comment below and we will get back to you as soon as possible.
Frequently Asked Question (FAQs)
How many MCQ questions are there in Class 9 Chapter 14 Math?
In Class 9 Chapter 14 Math, we have provided 20 Important MCQ Questions, But in the future, we will add more MCQs so that you can get good marks in the Class 9 exam.
Can we score good marks in Class 9 Math with the help of Statistics MCQ Questions?
Yes, MCQ Question is one of the best strategies to make your preparation better for the CBSE Board Exam. It also helps to know the student’s basic understanding of each Chapter. So, You can score good marks in the Class 9 Math exam.